Working with several clients or deeply on one domain in SEO can be very stressful during any of the frequent Google organic search algorithm updates. The data from Google Analytics only tells you that traffic is either up or down and the data from Google Search Console is extremely difficult to pull – especially for several clients and quickly. This is a guide that will help you quickly compare Google Search Console analytics data (clicks, impressions, reported CTR, reported position) between two dates and export the results into a .csv file.
This guide uses the following technologies:
- Python
- Google’s Webmaster API
- Jupyter (an open-source framework for data analysis)
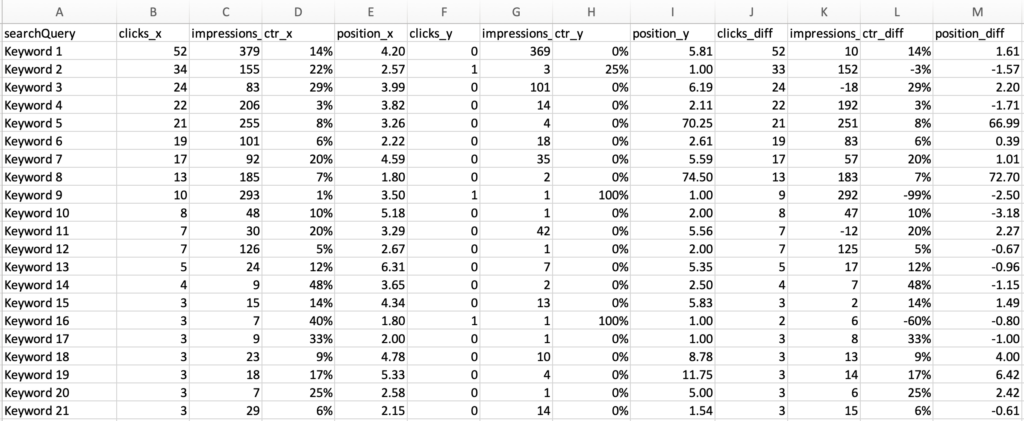
The end result should be a nice .csv file that looks like this (I redacted the keywords in this case :), the end result has real keywords, I promise):

Before getting started, you’ll need to download the code here (https://github.com/odagayev/jupyter_GSC).
Part 1 (this is for Python novices or people that are not proficients coders yet!)
- Install Python3 & Pip – this is actually a lot harder than it needs to be for folks just starting out. I don’t fully have a grasp on all of the dependencies and permissions so I’m gonna link the guides that I found useful during my experience.
- Installing Python3 – https://realpython.com/installing-python
- Installing pip3 – while this should be included in the above, here is a backup guide just in case https://automatetheboringstuff.com/appendixa/.
- Install venv (https://help.dreamhost.com/hc/en-us/articles/115000695551-Installing-and-using-virtualenv-with-Python-3)
- Download my code from Github.
- Open Terminal and create a virtual environment inside the code folder that you just downloaded. Type the following:
venv venvsource /venv/bin/activate- You should now see (venv) in Terminal next to your Terminal username.
Part 2 (Configure access from Google) – old-timers can skip to Part 4.
- Complete Step 1 listed here (https://developers.google.com/webmaster-tools/search-console-api-original/v3/quickstart/quickstart-python) – it should be “Enable the Search Console API”. This is so that you can get the CLIENT_ID and CLIENT_SECRET values for authentication
Part 3 (Running your first-time code) – old-timers can skip to Part 4.
- Type the following to install all dependencies on your machine in your terminal:
pip install -r requirements.txt- This should kick off a ton of installations of dependencies.
- Launch the Jupyter notebook by typing
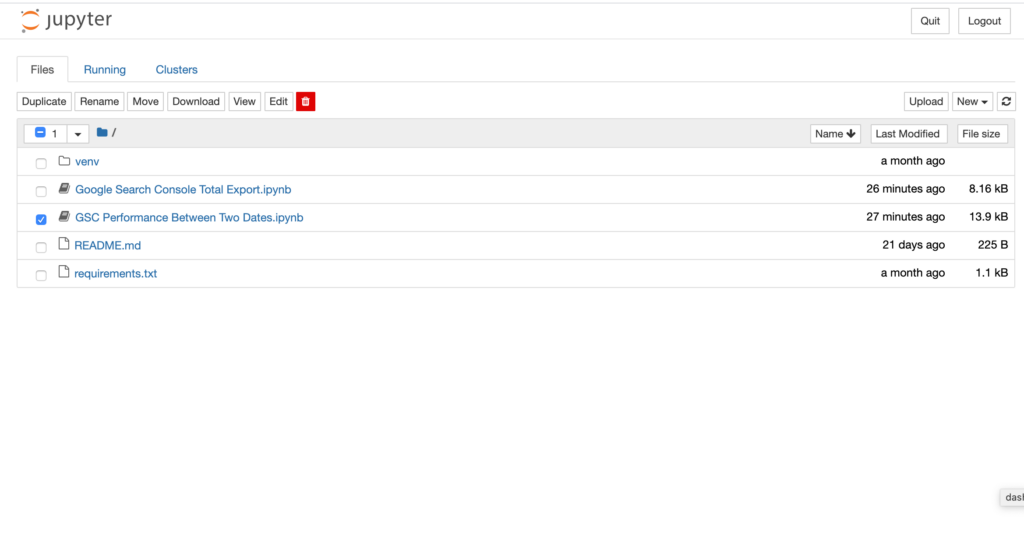
jupyter notebook - You should see something that resembles the following address in your terminal console: 127.0.0.1. Copy and paste that address into your address field in your browser. You should see something like the below in your browser:

- Click into the “GSC Performance Between Two Dates.ipynb” file.
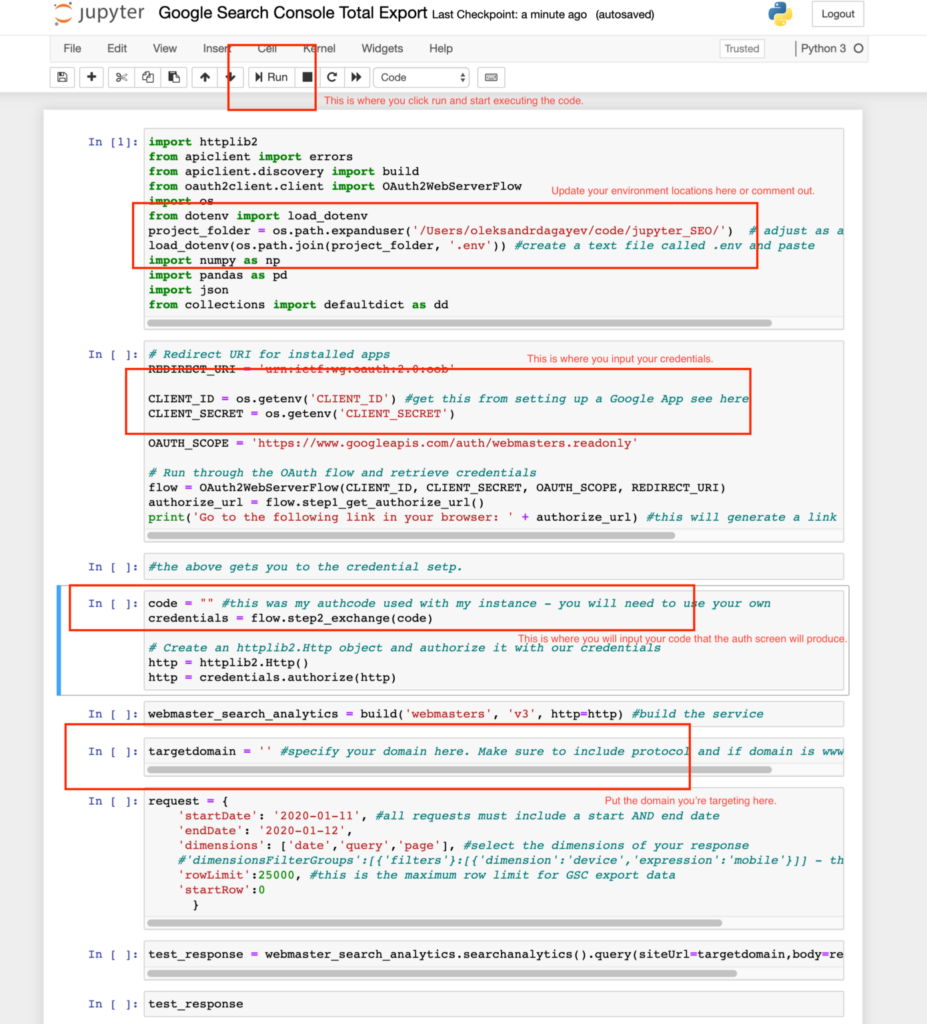
- A Jupyter Notebook works on a step by step basis. It works by going step by step through each “cell”. This makes it great for working with data and I think makes it easy for novices to follow code as it is being executed. Update the project folder value as is shown in the screenshot below and either create a
.envfile with theCLIENT_IDandCLIENT_SECRETvalues or paste those values directly into the script. If you’re pasting the values directly into the script put a # value in front of theproject_folder&load_dotenvlines in cell 1.

- Click on the generated link and you should be taken to an authentication screen by Google. Complete the authentication and copy the code and paste it into where it says
code = ""in between the"". Hit run until you get to the target domain step. In the code you have everything set up to make an API call at this point. Below we’re going to configure the actual request! - In between the parenthesis at target domain enter the domain you are targeting. Make sure to include the appropriate protocol and whether the domain is on www. or not. Lastly, make sure you actually have access to this domain in Search Console.
- Within the API request parameters, I outlined where to input values for dates and what dimensions you want. I recommend keeping this request as is on your first time through the process so that you can get the hang of it.
- Continue to hit Run until you get to
test_responseand run that cell. You should see a JSON object of the response and recognize the data. Conversely, if something got messed up during credentialing or creation of the request you should see an error message returned. - The next cell puts the JSON response into a dictionary and then the cell after that puts it into a nice table (this is called a pandas DataFrame in Jupyter speak but for our purposes, this is just a table).
Part 4 (understanding the difference)
- The next five cells define a function that iterates over the returned data and makes several requests so that you can get all of your search data out. This is done because Google only returns up to 25,000 data points at a time. So for larger sites, we’re making several requests until we don’t get 25,000 data points.
- In the cell titled
request1, you should see something very similar to the sample request we’ve made early in the notebook. This is the request where we are defining our first date range. - In the cell titled
request2, change the values of"startDate"&"endDate"to the appropriate values for the second date range that you would like to use. - Continue running the notebook and you should see that you have produced two data frames, one for each of the defined date ranges aggregated on the search query. Please note that I’ve used the following aggregation methodology:
- Clicks – sum (I’ve added all of the click volumes for the given date range)
- Impressions – sum (I’ve added all of the impression volumes for the given date range)
- CTR – average (I’ve averaged the CTR values for the given date range)
- Position – average (I’ve averaged the position values for the given date range)
- Once you get to the merging step the two data frames that you’ve produced become merged using an
inner join. This means that any of the keywords that are not in the 2nd date range but ARE in the 1st date range will be dropped from the new DataFrame. This shouldn’t affect 90% of use cases but if it affects yours, I’ve added guidance on how to address this into the notebook itself. - Continuing running the code and you’ll see that we do all of the calculation right in the notebook before giving you the option to export the results to a csv. Just FYI, in this guide – the clicks x numbers represent the data made in
request 2.
Stay safe out there.
